How to Install SigNoz on a Dedicated Server with Docker and OpenTelemetry
If your team is moving beyond basic uptime checks, self-hosted SigNoz with Docker is a good next step because it brings traces, metrics, and logs into one platform.
In this guide, self-hosted SigNoz with Docker runs on one dedicated server, while OpenTelemetry sends telemetry from your apps into SigNoz. This guide follows the current SigNoz Docker install method, which uses Foundry for Docker-based deployments.
For a stable production setup, it’s better to run SigNoz on a powerful dedicated server instead of a very small VPS.
Table of Contents
What This Self-Hosted SigNoz with Docker Setup Includes
The current Docker standalone deployment includes SigNoz, a SigNoz OpenTelemetry Collector, ClickHouse, ClickHouse Keeper, and PostgreSQL. In simple terms, the web app provides the UI, the collector receives telemetry, ClickHouse stores high-volume observability data, and PostgreSQL stores platform metadata.
Main parts include:
- SigNoz UI: the dashboard where you search traces, inspect logs, and view metrics.
- OpenTelemetry Collector: the pipeline that receives, processes, and forwards telemetry data.
- ClickHouse: the main data store for telemetry such as traces, logs, and metrics in the default single-node setup.
- Traces: show the full path of one request through your app.
- Metrics: show numbers over time, such as request rate, latency, memory use, and errors.
- Logs: show event messages that help with debugging.
Server Requirements for Self-Hosting SigNoz
Before you install anything, self-hosted SigNoz with Docker needs a Linux host, Docker Engine 20.10+, the Docker Compose v2 plugin, at least 4 GB of memory, and open ports 8080, 4317, and 4318.
Suggested starting sizes include:
| Use Case | CPU | RAM | Storage |
|---|---|---|---|
| Demo or Lab | 4 vCPU | 8 GB | 100 GB NVMe |
| Small Production | 8 vCPU | 16 GB | 250 GB NVMe |
| Growing Production | 12 to 16 vCPU | 32 GB or more | 500 GB or more NVMe |
As traffic grows, self-hosted SigNoz with Docker will write a lot of telemetry data, so SSD or NVMe storage is the right choice for a dedicated server. If your stack also includes heavier data or model workloads, you can plan that side separately with AI hosting architecture.
Prepare Your Server for SigNoz Setup
In this guide, we use Ubuntu 24.04. You must start on a fresh Ubuntu server, update your packages, and install the required tools:
sudo apt update && sudo apt upgrade -y
sudo apt install curl wget git ca-certificates gnupg lsb-release ufw -y
The SigNoz Docker guide requires Docker Engine 20.10 or newer plus the Docker Compose v2 plugin. To install it, you can use the commands below to add the repository:
sudo mkdir -p /etc/apt/keyrings
curl -fsSL https://download.docker.com/linux/ubuntu/gpg | sudo gpg --dearmor -o /etc/apt/keyrings/docker.gpg
echo \
  "deb [arch=$(dpkg --print-architecture) signed-by=/etc/apt/keyrings/docker.gpg] https://download.docker.com/linux/ubuntu \
  $(. /etc/os-release && echo "$VERSION_CODENAME") stable" | \
  sudo tee /etc/apt/sources.list.d/docker.list > /dev/null
Install Docker Engine and the Compose plugin:
sudo apt update
sudo apt install docker-ce docker-ce-cli containerd.io docker-buildx-plugin docker-compose-plugin -y
Enable and verify Docker:
sudo systemctl enable docker
sudo systemctl start docker
sudo systemctl status docker --no-pager
docker --version
docker compose version
You can also allow your user to run Docker without sudo:
sudo usermod -aG docker $USER
newgrp docker
SigNoz uses port 8080 for the UI, 4317 for OTLP over gRPC, and 4318 for OTLP over HTTP. Open only what you need.
If you use UFW:
sudo ufw allow OpenSSH
sudo ufw allow 8080/tcp
sudo ufw allow 4317/tcp
sudo ufw allow 4318/tcp
sudo ufw enable
sudo ufw statusNote: For safety, self-hosted SigNoz with Docker should expose the web UI carefully and keep OTLP ports private unless remote apps really need public access.
Install SigNoz with Foundry
The current supported way to deploy self-hosted SigNoz with Docker uses Foundry, and the older install.sh with the old deploy/ bundle are deprecated.
Install foundryctl with the command below:
curl -fsSL https://signoz.io/foundry.sh | bashReload the shell and verify the binary:
source ~/.bashrc 2>/dev/null || true
source ~/.zshrc 2>/dev/null || true
foundryctl version
Create a working directory:
mkdir -p ~/signoz-install
cd ~/signoz-install
Create casting.yaml file with the command below:
cat > casting.yaml <<'EOFYAML'
apiVersion: v1alpha1
kind: Installation
metadata:
  name: signoz
spec:
  deployment:
    flavor: compose
    mode: docker
EOFYAML
Then, deploy SigNoz:
foundryctl cast -f casting.yaml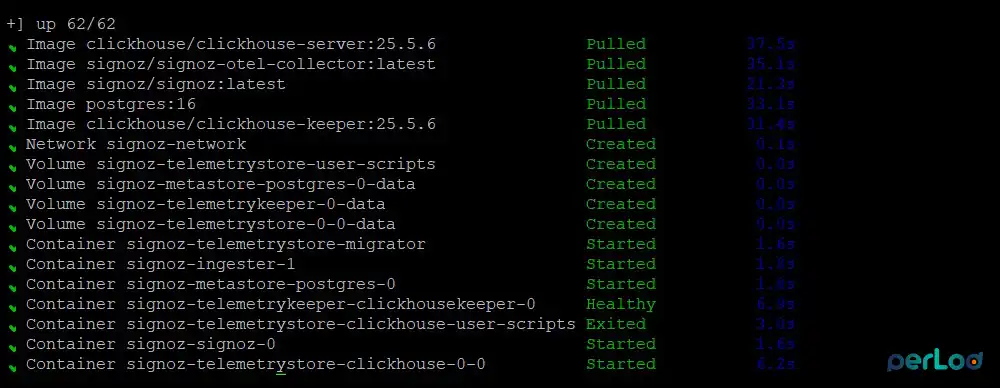
The cast workflow validates the host, generates the Docker Compose deployment in pours/deployment/, and starts the containers.
Verify the SigNoz Deployment
After deployment, the self-hosted SigNoz with Docker should listen on port 8080, while OTLP ingestion is available on port 4317 for gRPC and 4318 for HTTP.
Check the running containers:
docker ps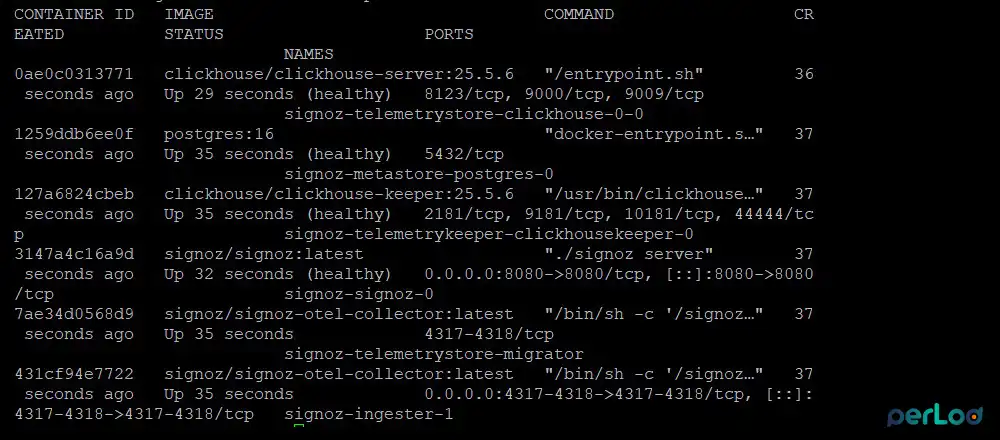
Check the listening ports:
sudo ss -tulpn | grep -E '8080|4317|4318'Now you can access the SigNoz UI in a browser and create your account:
http://YOUR_SERVER_IP:8080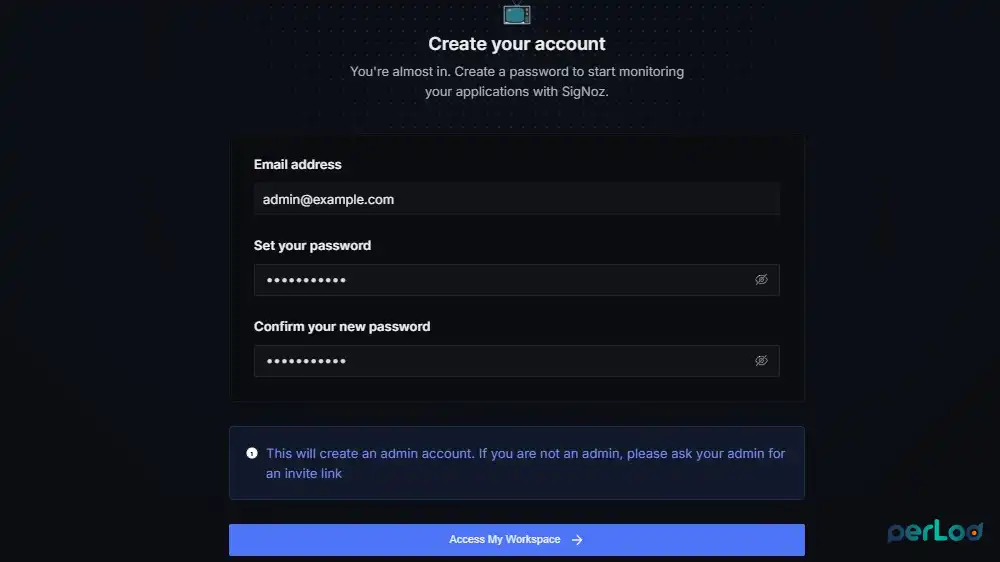
If you need logs, you can use:
docker compose -f ~/signoz-install/pours/deployment/compose.yaml logs -fIf the UI service needs closer inspection, you can run:
docker compose -f ~/signoz-install/pours/deployment/compose.yaml logs -f signoz-signoz-0Put the SigNoz UI behind Nginx and HTTPS
For a public-facing setup, it is better to place the SigNoz UI behind Nginx and add SSL. Let’s Encrypt HTTP-01 validation needs public access to port 80 during certificate checks.
Install Nginx and Certbot:
sudo apt install nginx certbot python3-certbot-nginx -yCreate a basic Nginx server block:
sudo nano /etc/nginx/sites-available/signozPaste the following config with your domain:
server {
    listen 80;
    listen [::]:80;
    server_name signoz.example.com;

    location / {
        proxy_pass http://127.0.0.1:8080;
        proxy_http_version 1.1;
        proxy_set_header Host $host;
        proxy_set_header X-Real-IP $remote_addr;
        proxy_set_header X-Forwarded-For $proxy_add_x_forwarded_for;
        proxy_set_header X-Forwarded-Proto $scheme;
    }
}
Enable it and reload Nginx:
sudo ln -s /etc/nginx/sites-available/signoz /etc/nginx/sites-enabled/
sudo nginx -t
sudo systemctl restart nginx
Finally, request the certificate:
sudo certbot --nginx -d signoz.example.comNote: If Certbot fails with a timeout, first check DNS, firewall rules, and whether port 80 is reachable from the public internet.
Now you can access your SigNoz UI from:
https://signoz.example.comUnderstand SigNoz Ingestion Endpoints and Collector
Self-hosted SigNoz accepts OTLP over gRPC on port 4317 and OTLP over HTTP on port 4318. With OTLP/HTTP, most SDKs automatically append paths such as /v1/traces, /v1/metrics, and /v1/logs to the endpoint.
Common environment variable examples include:
For gRPC:
export OTEL_EXPORTER_OTLP_PROTOCOL=grpc
export OTEL_EXPORTER_OTLP_ENDPOINT=http://YOUR_SERVER_IP:4317
export OTEL_EXPORTER_OTLP_TIMEOUT=30000
export OTEL_EXPORTER_OTLP_COMPRESSION=gzip
For HTTP:
export OTEL_EXPORTER_OTLP_PROTOCOL=http/protobuf
export OTEL_EXPORTER_OTLP_ENDPOINT=http://YOUR_SERVER_IP:4318
export OTEL_EXPORTER_OTLP_TIMEOUT=30000
export OTEL_EXPORTER_OTLP_COMPRESSION=gzip
SigNoz recommends using the OpenTelemetry Collector because it can receive data from many sources, batch it, enrich it, retry on failure, and give you a central place to shape telemetry before it reaches SigNoz.
In production, self-hosted SigNoz with Docker works better when you place an OpenTelemetry Collector between your apps and SigNoz.
This is helpful when you want to:
- Drop noisy spans or logs before storage.
- Add labels such as environment or team.
- Retry and queue data when the backend is busy.
- Keep app instrumentation simple while doing most routing in one place.
Send Your First Trace from Python
A first trace is the fastest way to confirm that self-hosted SigNoz with Docker is receiving data correctly.
First, install the Python tools:
sudo apt install python3 python3-pip python3-venv -yCreate a demo app folder, virtual environment, and activate it:
mkdir -p ~/otel-python-demo
cd ~/otel-python-demo
python3 -m venv venv
source venv/bin/activate
Install the required packages:
pip install opentelemetry-sdk opentelemetry-api opentelemetry-exporter-otlp-proto-grpcThen, create the app.py:
cat > app.py <<'EOFPY'
from opentelemetry import trace
from opentelemetry.sdk.resources import Resource
from opentelemetry.sdk.trace import TracerProvider
from opentelemetry.sdk.trace.export import BatchSpanProcessor
from opentelemetry.exporter.otlp.proto.grpc.trace_exporter import OTLPSpanExporter
import time

resource = Resource.create({"service.name": "demo-python-app"})
provider = TracerProvider(resource=resource)
processor = BatchSpanProcessor(
    OTLPSpanExporter(endpoint="http://YOUR_SERVER_IP:4317", insecure=True)
)
provider.add_span_processor(processor)
trace.set_tracer_provider(provider)
tracer = trace.get_tracer(__name__)

with tracer.start_as_current_span("first-demo-span"):
    time.sleep(0.5)
    print("trace sent")
EOFPYNote: Replace YOUR_SERVER_IP with the real IP or hostname of your SigNoz server. If the demo app runs on the same server, you can use http://localhost:4317 instead.
Run the app:
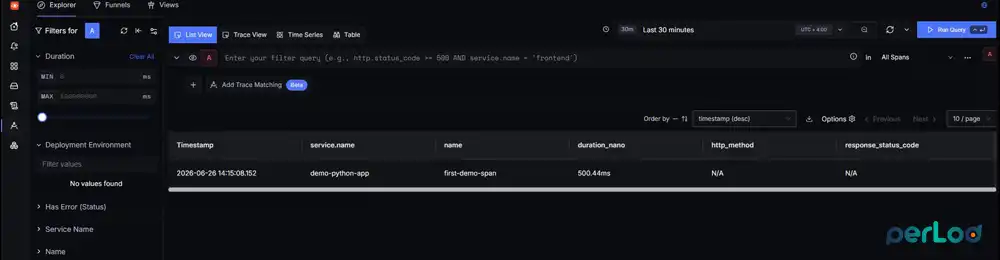
python3 app.pyThen open the SigNoz UI and look for the service name demo-python-app.
Use Your Own Collector (Optional)
If you want more control, self-hosted SigNoz with Docker can sit behind your own OpenTelemetry Collector gateway. In this model, your apps send data to your collector first, and that collector forwards data to SigNoz.
Create a folder for a custom collector:
mkdir -p ~/custom-otel-collector
cd ~/custom-otel-collector
Create otel-collector-config.yaml file:
cat > otel-collector-config.yaml <<'EOFYAML'
receivers:
  otlp:
    protocols:
      grpc:
        endpoint: 0.0.0.0:4317
      http:
        endpoint: 0.0.0.0:4318

processors:
  memory_limiter:
    check_interval: 5s
    limit_mib: 512
    spike_limit_mib: 128

  batch:
    timeout: 10s
    send_batch_size: 1024
    send_batch_max_size: 2048

  resource:
    attributes:
      - key: environment
        value: production
        action: upsert
      - key: collector.name
        value: custom-otel-gateway
        action: upsert

exporters:
  otlp:
    endpoint: SIGNOZ_SERVER_IP:4317
    tls:
      insecure: true
    compression: gzip
    timeout: 10s

extensions:
  health_check:
    endpoint: 0.0.0.0:13133

service:
  extensions: [health_check]
  pipelines:
    traces:
      receivers: [otlp]
      processors: [memory_limiter, resource, batch]
      exporters: [otlp]
    metrics:
      receivers: [otlp]
      processors: [memory_limiter, resource, batch]
      exporters: [otlp]
    logs:
      receivers: [otlp]
      processors: [memory_limiter, resource, batch]
      exporters: [otlp]
EOFYAML
Then, create the docker-compose.yml file:
cat > docker-compose.yml <<'EOFYAML'
services:
  otel-collector:
    image: otel/opentelemetry-collector-contrib:0.129.1
    container_name: custom-otel-collector
    command: ["--config=/etc/otelcol-contrib/otel-collector-config.yaml"]
    volumes:
      - ./otel-collector-config.yaml:/etc/otelcol-contrib/otel-collector-config.yaml:ro
    ports:
      - "14317:4317"
      - "14318:4318"
      - "13133:13133"
    restart: unless-stopped
EOFYAMLNote: On the same server, self-hosted SigNoz with Docker already uses ports 4317 and 4318, so a second collector should listen on different host ports, such as 14317 and 14318.
Start the custom collector:
docker compose up -d
docker ps
Check the health endpoint:
curl http://127.0.0.1:13133/healthNow point your apps to the custom collector instead of SigNoz directly:
export OTEL_EXPORTER_OTLP_PROTOCOL=grpc
export OTEL_EXPORTER_OTLP_ENDPOINT=http://YOUR_SERVER_IP:14317
Conclusion
Once it is running, self-hosted SigNoz with Docker gives small teams a clear path from basic monitoring to real observability. You get traces, metrics, and logs in one place, and you can grow from direct app export to a more controlled collector-based setup when your stack becomes more important.
For heavier workloads, self-hosted SigNoz with Docker is better on a PerLod dedicated server with enough CPU, RAM, and fast local storage.
We hope you enjoy this guide. You can use the official SigNoz Docker Standalone documentation for current deployment details and updates.
FAQs
What stores the telemetry data in SigNoz?
The default single-node deployment uses ClickHouse for telemetry data, while PostgreSQL is also part of the stack for metadata.
Do I need the OpenTelemetry Collector for SigNoz?
No, but it is strongly recommended for production because it adds filtering, retries, batching, and central control over telemetry flow.
What is the default retention for SigNoz?
By default, logs and traces are kept for 7 days, and metrics are kept for 30 days.
