Centralized Docker Logging with Grafana Alloy and Loki on a Linux VPS
Centralized logs make debugging containers much easier than tailing Docker logs per container. Using Grafana Alloy and Loki for Docker Logs on a Linux VPS gives you a modern way to collect, store, and query logs from containers and files in one place.
In this guide, you will set up Grafana Alloy and Loki for Docker Logs with Docker Compose, a Loki filesystem config that works with the latest version 3.7, and an Alloy config that supports both file logs and Docker logs.
Table of Contents
Prerequisites to Set Up Grafana Alloy and Loki for Docker Logs on a Linux VPS
To follow this guide on Grafana Alloy and Loki for Docker logs, you need:
- Linux VPS running Ubuntu 22.04 or newer with Docker and Docker Compose plugin installed.
- Basic familiarity with Docker, YAML, and Linux shell.
- A non‑root sudo user or root SSH access.
If you need a VPS for this setup, you can use an affordable Linux server from PerLod.
Connect to your VPS as root or a sudo user:
ssh root@your-server-ipUpdate the system:
apt update && apt upgrade -yInstall Docker and Docker Compose if it is not installed:
curl -fsSL https://get.docker.com | sh
apt install docker-compose-plugin -y
Now you can follow the steps below to set up Grafana Alloy and Loki for Docker logs.
Step 1: Create Logging Stack Directory Layout
First, you must create a simple project layout in your home directory:
mkdir -p ~/logging-stack/{alloy,loki}
cd ~/logging-stack
We will keep the Loki config under loki/ and the Alloy config under alloy/ while running Grafana Alloy and Loki for Docker logs with a single Compose file.
Step 2: Loki 3.7 Single‑Node Filesystem Setup
Loki 3.7 needs a small but specific YAML configuration when you run it as a single binary on local disk. Here is a simple filesystem‑based Loki config that works well on a small Linux VPS, avoids structured metadata requirements, and keeps about a week of logs without needing any external object storage.
Create the Loki YAML file:
cat > loki/loki-config.yml << 'EOF'
auth_enabled: false

server:
  http_listen_port: 3100

common:
  instance_addr: 127.0.0.1
  path_prefix: /var/loki
  storage:
    filesystem:
      chunks_directory: /var/loki/chunks
      rules_directory: /var/loki/rules
  replication_factor: 1
  ring:
    kvstore:
      store: inmemory

schema_config:
  configs:
    - from: 2020-10-24
      store: boltdb-shipper
      object_store: filesystem
      schema: v13
      index:
        prefix: index_
        period: 24h

compactor:
  working_directory: /var/loki/compactor

limits_config:
  retention_period: 168h
  max_query_lookback: 168h
  ingestion_rate_mb: 4
  ingestion_burst_size_mb: 8
  allow_structured_metadata: false

ruler:
  storage:
    type: local
    local:
      directory: /var/loki/rules
  rule_path: /var/loki/rules-temp
  ring:
    kvstore:
      store: inmemory
  alertmanager_url: ""
EOF
This config runs Loki as a single process on local filesystem storage with seven days of retention, and explicitly disables structured metadata to satisfy Loki 3.7’s validation when using boltdb-shipper.
Step 3: Grafana Alloy Setup for Loki | File and Docker Sources
At this point, you must configure Grafana Alloy to send logs into Loki from two places, including a local log file and Docker containers. The file source gives you a guaranteed working path for testing, while the Docker source shows the modern way to collect container logs with Grafana Alloy and Loki for Docker logs.
Create an Alloy config file with both a file source and a Docker source:
cat > alloy/config.alloy << 'EOF'
logging {
  level  = "info"
  format = "logfmt"
}

loki.source.file "file_logs" {
  targets = [{
    __path__ = "/tmp/alloy-logs/test.log",
    job      = "file-test",
  }]

  forward_to = [loki.write.local_loki.receiver]
}

loki.source.docker "docker_logs" {
  host = "unix:///var/run/docker.sock"

  targets = [{
    job = "docker",
  }]

  labels = {
    job  = "docker",
    host = "vps-1",
  }

  forward_to = [loki.write.local_loki.receiver]
}

loki.write "local_loki" {
  endpoint {
    url = "http://loki:3100/loki/api/v1/push"
  }
}
EOF- loki.source.file tails
/tmp/alloy-logs/test.logand sends logs with labeljob="file-test"to Loki. - loki.source.docker connects to the Docker socket and is ready to send container logs with
job="docker". You can build on this for Docker labels and filtering.
Step 4: Run Loki, Alloy, and Grafana with Docker Compose
Now you must define a Docker Compose file that starts Loki, Grafana, and Grafana Alloy together on your VPS. This shared stack keeps everything on a single Docker network, exposes only the ports you need, and makes it easy to bring the whole Grafana Alloy and Loki for Docker Logs setup up or down with a single command.
Create the Docker Compose YAML file in your project directory:
cat > docker-compose.yml << 'EOF'
services:
  loki:
    image: grafana/loki:3.7.0
    container_name: loki
    command: -config.file=/etc/loki/loki-config.yml
    volumes:
      - ./loki/loki-config.yml:/etc/loki/loki-config.yml:ro
      - loki-data:/var/loki
    ports:
      - "3100:3100"
    restart: unless-stopped

  alloy:
    image: grafana/alloy:latest
    container_name: alloy
    command: >
      run /etc/alloy/config.alloy
    volumes:
      - ./alloy/config.alloy:/etc/alloy/config.alloy:ro
      - /var/run/docker.sock:/var/run/docker.sock:ro
      - /tmp/alloy-logs:/tmp/alloy-logs:ro
    depends_on:
      - loki
    restart: unless-stopped

  grafana:
    image: grafana/grafana:latest
    container_name: grafana
    environment:
      - GF_SECURITY_ADMIN_USER=admin
      - GF_SECURITY_ADMIN_PASSWORD=admin
    volumes:
      - grafana-data:/var/lib/grafana
    ports:
      - "3000:3000"
    depends_on:
      - loki
    restart: unless-stopped

volumes:
  loki-data:
  grafana-data:
EOF
This Compose file starts Loki on 3100, Grafana on 3000, and Alloy with access to both the Docker socket and a host directory for test file logs, which is a common way to run Grafana Alloy and Loki for Docker logs on a single node.
Once you are done, you can start the stack and verify it with the commands below:
docker compose up -d
docker compose ps
You should see Loki, Alloy, and Grafana all Up. If Loki fails, use docker logs loki --tail=50 and fix config typos based on the Loki YAML file.
Step 5: Send a Test Log File to Loki via Alloy
In this step, you can create a simple file on the VPS and let Alloy stream its contents into Loki. This gives you a verified path to confirm that Grafana Alloy and Loki for Docker logs are connected correctly before you depend on Docker logs in production.
From your server, create the test file with:
mkdir -p /tmp/alloy-logs
touch /tmp/alloy-logs/test.log
Then, start a background writer with:
while true; do echo "$(date) - hello from file log" >> /tmp/alloy-logs/test.log; sleep 2; doneAlloy now tails /tmp/alloy-logs/test.log via loki.source.file and pushes those lines to Loki using the file-test job label.
Step 6: Connect Grafana to Loki
To access the Grafana dashboard, open your browser and navigate to:
http://YOUR_SERVER_IP:3000Log in as:
- User: admin
- Password: admin. Change it immediately.
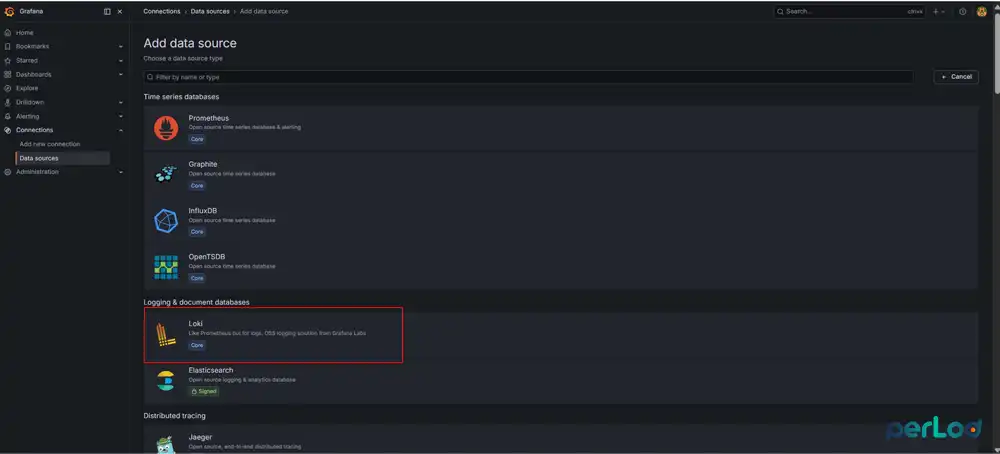
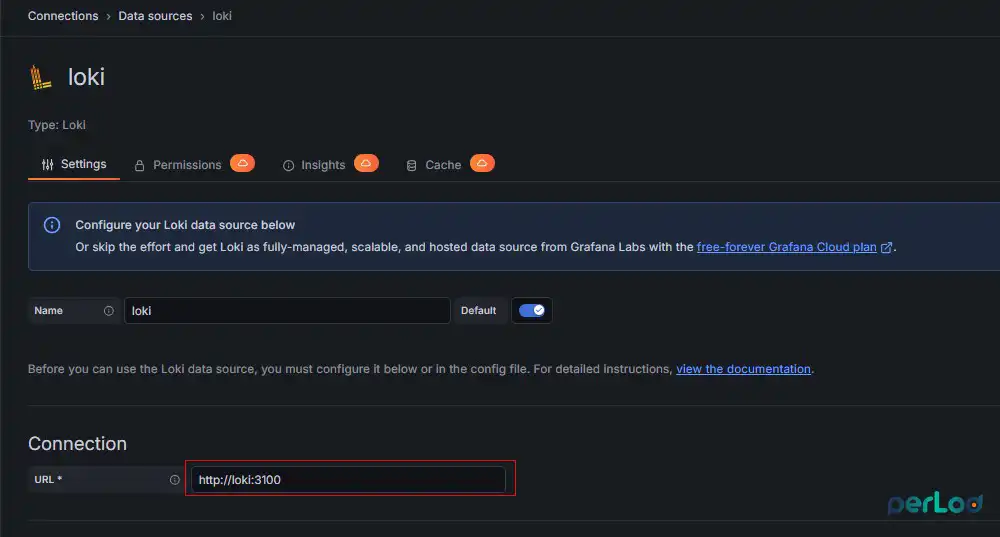
Then, add Loki as a data source:
Go to Connections → Data sources, click Add data source, and choose Loki.
From there, set the URL to:
http://loki:3100Click Save & test and make sure it reports a successful connection.
Step 7: Verify File Logs from Alloy in Grafana
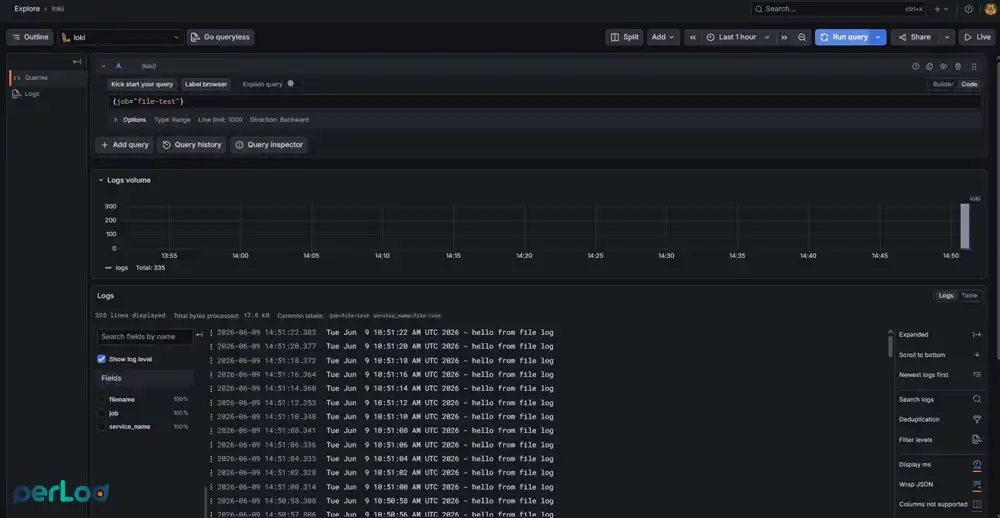
At this point, you must confirm that your test file logs are stored and searchable. Go to Explore in Grafana:
Pick the Loki data source and the query field (Code mode), enter:
{job="file-test"}Set the time range to Last 15 minutes and click Run query.
You should see lines like “hello” from the file log with labels job=”file-test” and service_name=”file-test”, confirming that Grafana Alloy and Loki for Docker logs are working at least for the file pipeline.
Step 8: Docker Test Container for Grafana Alloy and Loki
Here you can start a small container that prints a message every few seconds, so it generates a steady stream of logs. These logs let you test the Docker path in your Grafana Alloy and Loki for Docker logs setup and verify that container output is reaching Loki and Grafana correctly.
Start the container with:
docker run --rm --name log-test busybox sh -c 'i=0; while true; do echo "hello from container $i"; i=$((i+1)); sleep 2; done'This container writes to stdout, which Docker stores in its JSON log files; Alloy’s loki.source.docker component reads those logs via /var/run/docker.sock and sends them to Loki with job=”docker” when configured correctly.
In Grafana Explore, try:
{job="docker"}If needed, use Label browser to inspect live labels Alloy sends along with Docker logs.
Note: As of 2026, loki.source.docker behavior continues to evolve, and some environments may need extra tweaks or an Alloy version pin for Docker logs, but the configuration shown here matches current Alloy patterns for Grafana Alloy and Loki for Docker logs.
Retention, Security, and Production Tips
It is best to tune how long Loki keeps logs, think about basic security for your endpoints, and see what changes when you move this Grafana Alloy and Loki for Docker logs setup from a small lab VPS into a real production environment.
- Adjust retention_period in loki-config.yml to match your disk size; shorter retention is safer on small VPS plans.
- Protect the Grafana UI and Loki endpoint behind a firewall or reverse proxy in production.
- Mounting /var/run/docker.sock gives Alloy broad power over Docker; only do this on hosts you control and trust.
For larger deployments or centralized logging from many servers, you can move Loki and Grafana to a stronger machine like a high-performance dedicated server and run Alloy agents on each VPS, still following the same Grafana Alloy and Loki for Docker logs pattern.
Conclusion
You now have a full working setup of Grafana Alloy and Loki for Docker Logs on a Linux VPS using Docker Compose, with Loki for storage, Alloy for log collection, and Grafana for search and dashboards. By tuning labels, filters, and retention, Grafana Alloy and Loki for Docker Logs give you a modern, light, and flexible logging stack that runs even on small VPS plans.
We hope you enjoy this guide. For more details on Alloy log components and examples, you can see the official ingesting logs to Loki using Alloyi docs.
FAQs
How can I lower noise with Grafana Alloy?
You lower the noise in Grafana Alloy by filtering containers by label and dropping healthcheck lines in the Alloy config.
Can I send logs to Grafana Cloud with Grafana Alloy?
Yes, you can change the loki.write URL so it pushes data to a Grafana Cloud Loki endpoint instead of a local Loki.
Do I need Promtail for Grafana Alloy and Loki?
No, Grafana Alloy and Loki for Docker Logs use Alloy as the log agent instead of Promtail in modern setups.
