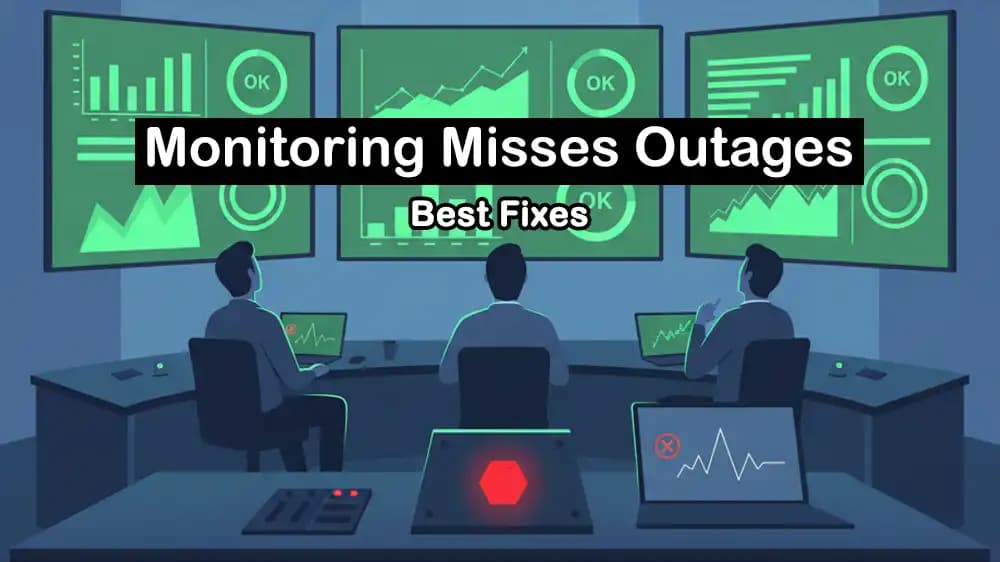
Monitoring misses outages means your monitoring shows everything is OK, but users are actually experiencing a real outage or failure. This usually happens when you only monitor internal signals, including server up, CPU, and containers running, instead of user-visible checks, like whether a user reaches the site and completes a request successfully.
You can fix this issue by building alerts around user-impacting SLIs, including success and latency, with a few outside checks that act like a user. Then page when the service is breaking its reliability target, not when server metrics are just noisy.
In this guide from PerLod Hosting, we want to discover why monitoring dashboards look healthy during outages and how to design alerting that catches real failures.
Why Monitoring Misses Outages: The Most Common Causes
Monitoring dashboards can look perfectly healthy even while users are facing a real outage. This usually happens when monitoring focuses on internal system metrics instead of what customers actually experience.
Here we want to explore the most common reasons monitoring misses outages, so you can build alerts that catch real failures early.
Internal monitoring can miss real user problems:
Internal metrics can look fine even when users cannot use the service, like DNS issues, routing problems, CDN blocks, auth outages, and broken dependencies. That is why SRE best practice is to combine internal monitoring with a few critical external checks that act like real users.
You are only looking at average latency, not the slowest requests:
A dashboard can show normal average latency even when the slowest users are getting very bad delays, like the 95th and 99th percentiles. Tail latency is often what breaks user experience the most, so it is important to track percentiles or latency distributions, not just averages.
Errors are measured incorrectly or filtered out:
If your latency chart only includes successful requests, it can hide outages. During a failure, the service may return fast 5xx errors, so the success latency graph looks better, even though users are failing. Track latency for both successful and failed requests.
Traffic is still flowing, but users are not succeeding:
Requests per second can stay normal during an outage because retries and bots keep sending requests, so traffic does not mean users are actually succeeding.
Dependency-based alert rules can mute the wrong alerts and hide the real outage:
Complex dependency chains are fragile, so "only alert if another system is healthy" rules can hide real issues when that dependency status is wrong or outdated.
Monitoring Misses Outages SLIs: The Metrics That Reflect Real User Impact
SLIs (Service Level Indicators) are the key metrics that show what users actually experience, not just what your servers report.
At this point, you can learn which SLIs to track so outages do not get missed when dashboards look healthy. These SLIs help you alert on real failures like errors and slow responses, before they turn into major problems.
Common SLIs that catch dashboards-look-healthy outages include:
1. Availability SLI (request success ratio): This answers whether requests are working.
- Good: Requests that succeed usually return HTTP 2xx/3xx, or your app’s definition of success.
- Bad: Failures, including HTTP 5xx, timeouts, and connection errors. Also, you can decide that too slow counts as bad if slow responses are effectively broken for users.
Servers can be up while users get errors. This availability SLI directly measures success versus failure.
2. Latency SLI (fast ratio): This answers whether requests are fast enough for users.
- Good: Requests faster than a threshold, for example, under 300ms.
- Bad: Requests slower than that threshold.
Note: Do not mix failed requests into the same latency view without thinking. Failures can return very fast, which can make latency look better during an outage. Track success latency and failure latency separately when possible.
3. Black-box probe SLI (synthetic checks): This answers whether a real user reaches and uses the service from the outside.
- Run a probe from outside your system or from a separate monitoring location that hits a URL or flow.
- Good: Probe succeeded.
- Bad: Probe failed.
For example, in a Prometheus setup, probe_success is typically 1, which means succeeded, and 0 means failed.
This SLI catches hidden outages because it detects DNS, CDN, routing, TLS, and auth issues that internal metrics often miss.
Here is a Prometheus example for SLI recording:
Request error ratio:
sum(rate(http_requests_total{job="api", code!~"2..|3.."}[5m]))/sum(rate(http_requests_total{job="api"}[5m]))
Explanation:
- http_requests_total is a counter that keeps increasing as requests happen.
- rate(…[5m]) converts that counter into requests per second over the last 5 minutes.
- The top counts bad responses, not 2xx/3xx.
- The bottom counts all responses.
- The result is a ratio like 0.02, which means 2% errors.
You can put it on a dashboard as an error ratio and alert when it goes above your acceptable level.
Black-box “can I reach it” availability:
avg_over_time(probe_success{job="blackbox", instance="https://example.com"}[5m])
- probe_success is 0 or 1 for each probe run.
- avg_over_time(…[5m]) averages the last 5 minutes of results.
- If it is 1.0, probes are consistently passing.
- If it is 0.0, probes are consistently failing.
- Values in between, like 0.6, mean it is flapping, some passes and some fails.
How To Fix Monitoring Misses Outages Issue?
When monitoring misses outages, the problem usually is not a lack of dashboards. It is that alerts are not measuring what real users experience. In this step, you can implement simple fixes to catch real failures, like alerting on user-impact SLIs and using a few external checks.
Design Alerting to Catch Real Failures
Symptom-first alerting means you trigger alerts based on what users actually experience, like failed requests or very slow responses. This keeps pages focused on real outages instead of noisy server signals.
- Page when users are actually impacted, not just when a server metric looks weird.
- Turn your SLIs into SLO burn-rate alerts, so you get paged when you are burning error budget too fast, not when CPU spikes for a moment.
On a dedicated server, you also get more predictable performance, which makes SLI and SLO trends and alert thresholds easier to trust and tune.
Use Multi Window Burn Rate Alerts
Recommended SLO burn-rate alert pattern:
SRE best practice recommends using multiwindow burn-rate alerts. It only fires when both the short-term and long-term error rates are high, so you catch real issues fast, and the alert clears quickly after recovery.
For example, assume:
- SLO: 99.9% over 30 days, so error budget = 0.1% = 0.001
- You already have metrics that track your service’s error rate over different time windows, like the last 5 minutes and the last 1 hour.
Page for a major outage when the error budget is burning very fast in both the last 5 minutes and the last 1 hour:
1- alert: SLOHighBurnRatePage2 expr: job:slo_errors_per_request:ratio_rate1h{job="api"} > (14.4 * 0.001)3 and job:slo_errors_per_request:ratio_rate5m{job="api"} > (14.4 * 0.001)4 for: 0m5 labels:6 severity: page
This triggers a page fast when users start failing, and it also stops alerting soon after the service recovers because the short time window improves reset speed.
Ticket for a slow problem when the error budget is steadily burning over both the last 6 hours and the last 3 days:
1- alert: SLOSlowBurnTicket2 expr: job:slo_errors_per_request:ratio_rate3d{job="api"} > (1 * 0.001)3 and job:slo_errors_per_request:ratio_rate6h{job="api"} > (1 * 0.001)4 for: 0m5 labels:6 severity: ticket
This catches issues that are not a full outage, but where users are consistently failing little by little, so the dashboard can still look mostly fine.
Add Black Box Monitoring to Catch Hidden Outages
Black-box monitoring checks your service from the outside, as a real user would. It helps you catch outages that internal dashboards can miss, such as DNS issues, routing problems, or broken login flows.
You can add a few simple external checks to stop green internal metrics from hiding real downtime.
With Prometheus Blackbox Exporter, the /probe check returns probe_success, where 1 means OK and 0 means failed, and you can alert when it fails or when the target does not meet your rules.
For example, a site-down alert from probes:
1- alert: BlackboxProbeFailing2 expr: probe_success{job="blackbox", instance="https://example.com"} == 03 for: 2m4 labels:5 severity: page
- probe_success == 0: The external check failed, so users likely cannot reach or use the endpoint.
- for: 2m: Only alert if it keeps failing for 2 minutes, to avoid paging on a one-time glitch.
Conclusion
At this point, you have learned that monitoring misses outages when green dashboards measure internal health instead of real user success. The best solution is to shift from noisy server-metric alerts to symptom-based alerts. You must measure what users feel, add a few outside checks that act like real users, and page based on SLO burn rate so you only get paged when reliability is actually in danger.
With this method, alerts are more accurate, outages are detected faster, and teams waste less time on false alarms and focus more on fixing real issues.
We hope you enjoy this guide. Subscribe to our X and Facebook channels to get the latest articles.
For further reading:
Monitor Linux Logs with OpenSearch Filebeat Compatibility
PostgreSQL Autovacuum Tuning for Optimizing Performance