How to Install Uptime Kuma on a VPS with HTTPS, Notifications, and a Public Status Page
If you want to keep an eye on your websites and services without paying for a third-party monitoring tool, learning how to install Uptime Kuma on your own VPS is a good choice. Uptime Kuma is a free, open-source, and self-hosted monitoring tool that gives you real-time status updates, smart alerts, and a public status page, all running on your own server.
This guide will show you how to deploy Uptime Kuma with Docker Compose, set up HTTPS with Nginx and Certbot, configure Telegram and email notifications, and publish a public status page your users can trust.
Table of Contents
What You Need for Uptime Kuma Setup
Before you install Uptime Kuma, make sure you have:
- A Linux VPS running Ubuntu 24.04 LTS or newer. A 1 vCPU and 1 GB RAM VPS is enough for most small setups.
- A domain name pointing to your VPS IP.
- Root or sudo access via SSH.
- Ports 80 and 443 are open on your firewall.
If you need a VPS to get started, you can launch your monitoring stack on a PerLod Linux VPS, which offers affordable plans perfect for self-hosted tools like Uptime Kuma.
Prepare Your Server and Install Required Tools
First, log in to your VPS via SSH and run a full system update:
apt update && apt upgrade -yThis makes sure you are working with the latest packages and security patches.
Docker is the easiest and most reliable way to install Uptime Kuma. To install Docker and Docker Compose, run the commands below:
curl -fsSL https://get.docker.com | sh
apt install docker-compose -y
Verify both are installed correctly by checking the version:
docker --version
docker-compose --version
Once you are done with these, proceed to the following steps to complete Uptime Kuma setup.
Install Uptime Kuma with Docker Compose
Create a directory for Uptime Kuma and move into it:
mkdir -p ~/uptime-kuma && cd ~/uptime-kumaThen, create a Docker Compose YAML file with the command below:
nano docker-compose.ymlPaste the following configuration:
services:
  uptime-kuma:
    image: louislam/uptime-kuma:2
    container_name: uptime-kuma
    restart: unless-stopped
    ports:
      - "127.0.0.1:3001:3001"
    volumes:
      - ./data:/app/data
    environment:
- TZ=UTCNote: We bind to 127.0.0.1:3001 instead of 0.0.0.0:3001, so the port is only accessible locally. Nginx will handle all public traffic. Remember to replace UTC with your timezone.
Save and close the file, then start the container with the command below:
docker-compose up -dCheck that it is running:
docker psYou should see uptime-kuma listed with status Up.
Set up Firewall Rules
Before installing Nginx, you must open the right ports with UFW:
apt install ufw -y
ufw allow OpenSSH
ufw allow 80/tcp
ufw allow 443/tcp
ufw enable
ufw status
This lets through SSH, HTTP, and HTTPS traffic while keeping everything else blocked.
Configure Nginx for Uptime Kuma
Now you can install Nginx as a reverse proxy, along with Certbot for free SSL certificates from Let’s Encrypt:
apt install nginx certbot python3-certbot-nginx -yCreate a new Nginx config file for your subdomain:
nano /etc/nginx/sites-available/uptime-kumaPaste this configuration with your actual subdomain:
server {
    listen 80;
    server_name status.yourdomain.com;

    location / {
        proxy_pass         http://127.0.0.1:3001/;
        proxy_http_version 1.1;

        proxy_set_header   Upgrade $http_upgrade;
        proxy_set_header   Connection "upgrade";
        proxy_set_header   Host $host;
        proxy_set_header   X-Real-IP $remote_addr;
        proxy_set_header   X-Forwarded-For $proxy_add_x_forwarded_for;
        proxy_set_header   X-Forwarded-Proto $scheme;
    }
}
We use Upgrade and Connection headers because Uptime Kuma is built on WebSocket. Without these two headers, the real-time dashboard will not work behind a reverse proxy.
Enable the config and test it:
ln -s /etc/nginx/sites-available/uptime-kuma /etc/nginx/sites-enabled/
nginx -t
systemctl reload nginx
Once you are done, run Certbot:
certbot --nginx -d status.yourdomain.comCertbot will automatically edit your Nginx config to add HTTPS, redirect HTTP to HTTPS, and set up auto-renewal.
Test the auto-renewal to make sure it works:
certbot renew --dry-runFor deeper Nginx WebSocket proxy configuration and troubleshooting, check the NGINX WebSocket proxying.
Uptime Kuma Initial Setup
At this point, you can open your browser and navigate to:
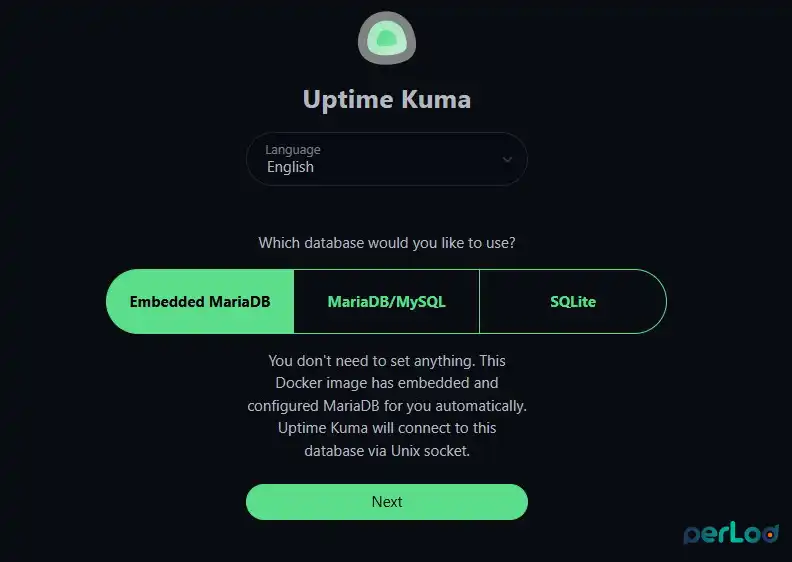
https://status.yourdomain.comYou will see the first-time setup page. For a small setup, you can choose Embedded MariaDB and click Next.
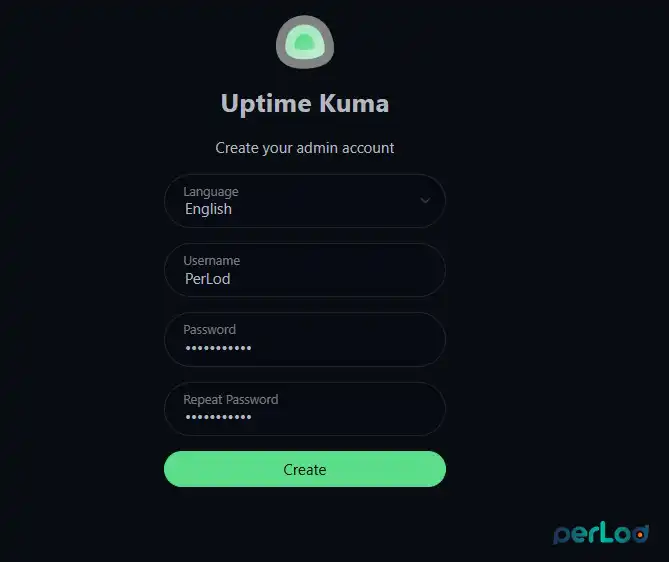
Create your admin account with a strong username and password.
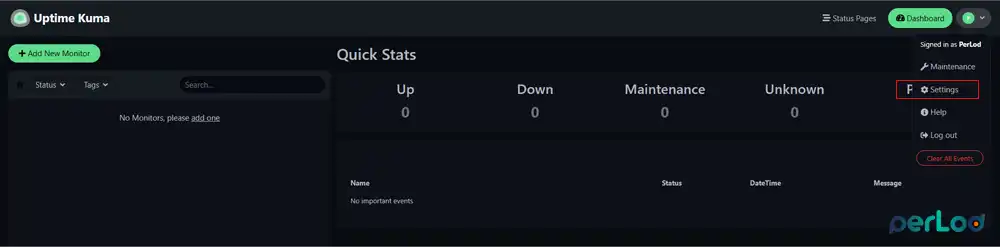
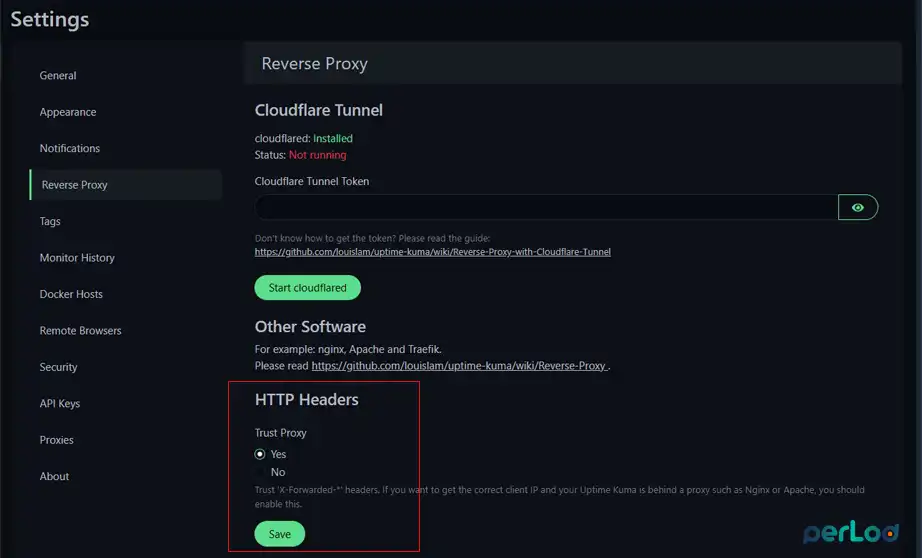
Once logged in, go to Settings.
Select Reverse Proxy and from HTTP Headers, set Trust Proxy to Yes. This makes sure Uptime Kuma logs the correct client IP addresses from the X-Forwarded-* headers passed by Nginx.
Add First Monitor to Uptime Kuma
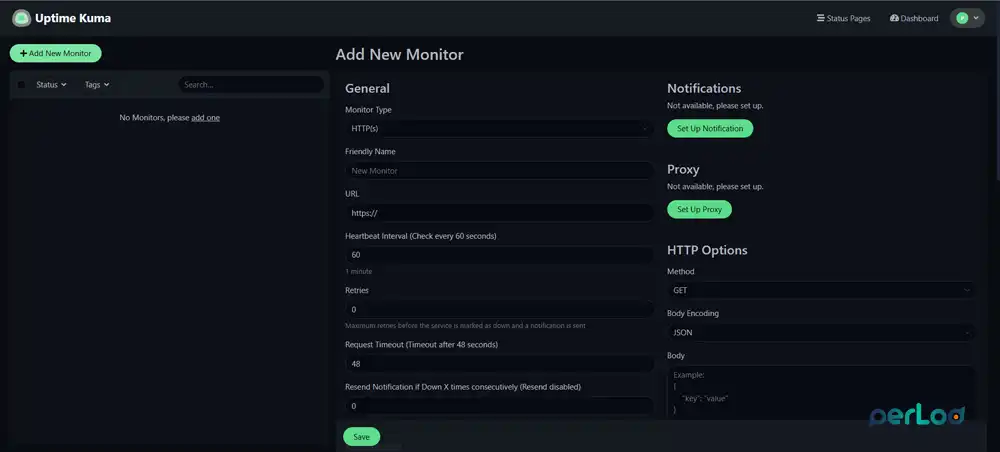
This is the core of what you install Uptime Kuma for. Click Add New Monitor and fill in the details:
- Monitor Type: HTTP(s)
- Friendly Name: My Website
- URL:
https://yourdomain.com - Heartbeat Interval: 60 seconds
- Retries: 1–3
Click Save.
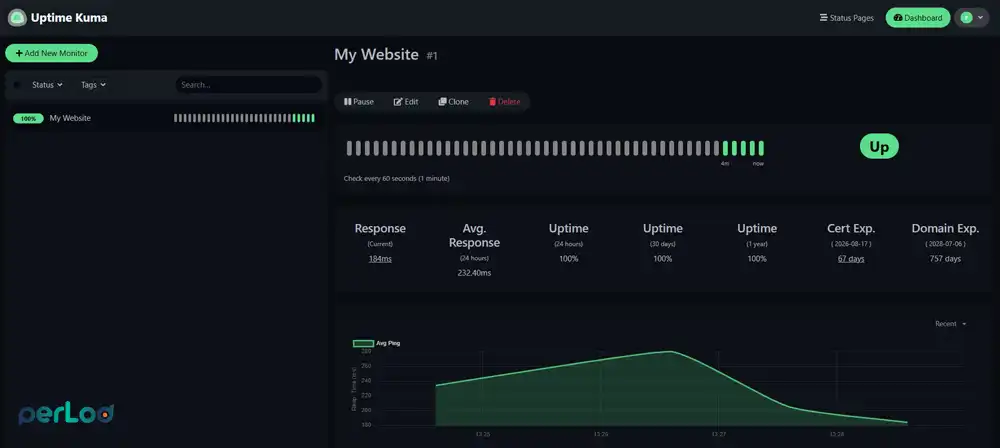
Uptime Kuma will start pinging your URL immediately and show the response time and uptime on the dashboard.
Set Up Uptime Kuma Notifications
Telegram is a recommended option for notifications because it is free and a great choice for real-time alerts.
To set it up, you must create a Telegram Bot:
- Open Telegram and search for BotFather.
- Send /newbot and follow the prompts to name your bot.
- BotFather will give you a Bot Token. You must copy it.
Then, you must get your chat ID:
- Search for userinfobot on Telegram.
- Send /start.
- It will reply with your Telegram Chat ID. Copy this too.
Now you can connect to Uptime Kuma:
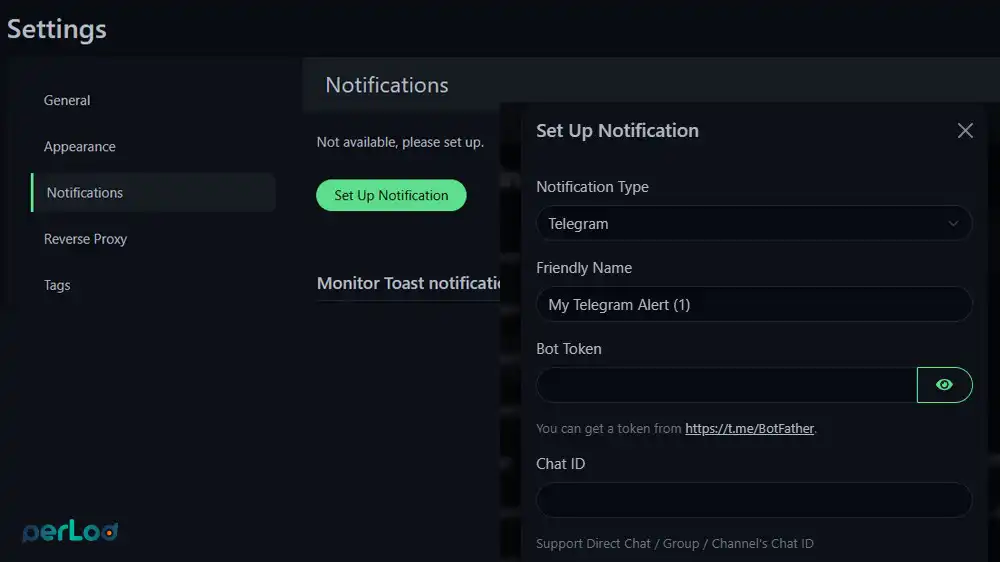
- In Uptime Kuma, go to Settings → Notifications.
- Click Set up Notification.
- Choose Telegram.
- Paste your Bot Token and Chat ID.
- Click Test, you should get a test message on Telegram instantly.
- Click Save.
If you prefer email alerts, you can use Gmail with an App Password:
- In your Google Account, go to Security → App Passwords and generate one.
- In Uptime Kuma, go to Settings → Notifications → Set up Notification.
- Choose Email (SMTP) and fill in:
- Hostname:
smtp.gmail.com - Port: 587
- Security: STARTTLS
- Username: your Gmail address
- Password: your App Password, not your regular Gmail password.
- From / To: your email address.
- Hostname:
- Click Test, then Save.
After saving a notification channel, go back to your monitor, click Edit, scroll down to the Notifications section, and toggle on your Telegram or email notification. This links the alert channel to that specific monitor.
Set Up a Public Status Page in Uptime Kuma
The status page is a public page where your users or customers can see whether your services are up or down, no login needed.
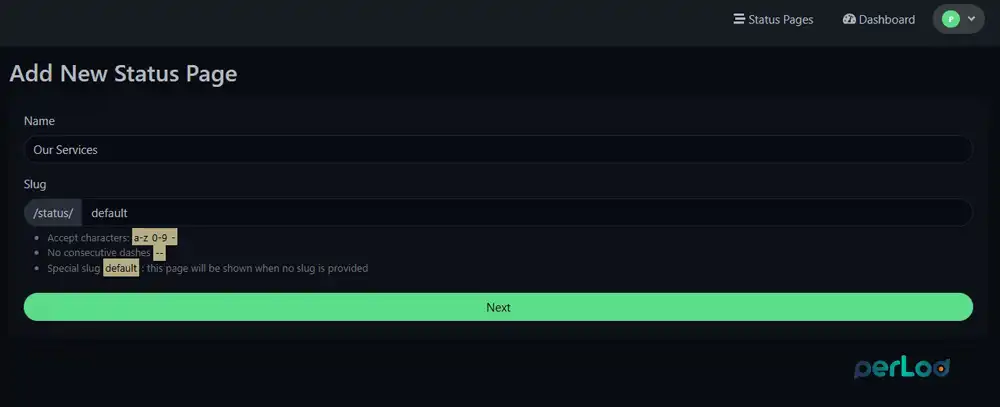
To create the Status Page, click Status Page in the left sidebar, then select Add New Status Page. Give it a name like Our Services and a URL slug like default. Once you are done, click Next.
From there, you can add monitors to the page. To do this, click Add Group, then add your monitors to that group. You can show or hide specific monitors on the public page; you do not have to expose everything.
To add your Custom Domain, in the status page settings sidebar, look for the Domain field. Add your subdomain here.
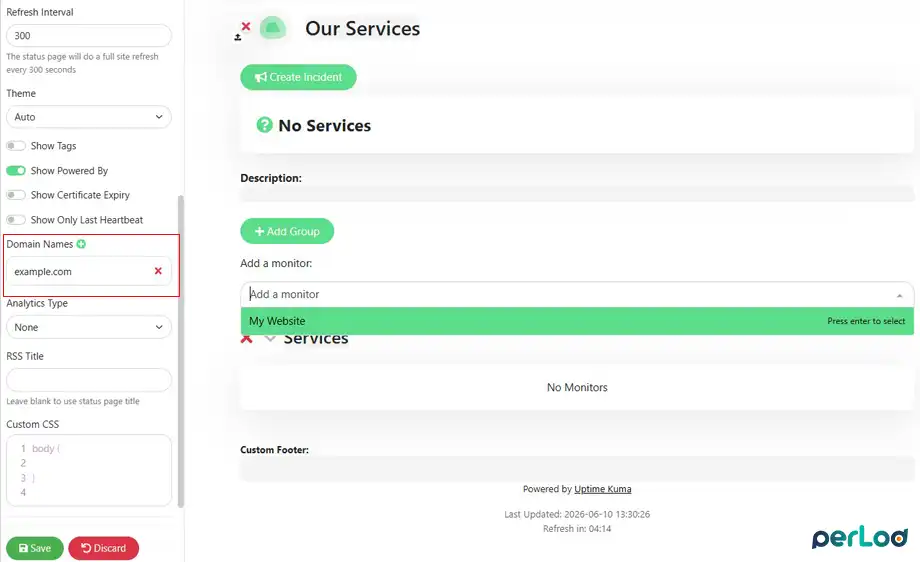
Then make sure your Nginx config forwards the Host header correctly, which we already do in the config file. Once saved, your status page is live at:
https://status.yourdomain.com/status/defaultIf you need a domain for your status page, you can register one at PerLod’s domain registration page and point it to your VPS in minutes.
How to Update Uptime Kuma
When a new version of Uptime Kuma is released, updating with Docker Compose is simple:
cd ~/uptime-kuma
docker-compose pull
docker-compose up -d
Docker will pull the latest image and restart the container. Your data stays safe in the ./data volume.
VPS Specs Needed for Uptime Kuma
You do not need a powerful server to run this setup. Here is what you need to install Uptime Kuma:
| Resource | Typical Usage |
|---|---|
| RAM | ~400 MB with 20 to 50 monitors |
| CPU | Under 5% of 1 vCPU |
| Disk | ~200 MB for app and data |
| VPS Minimum | 1 vCPU, 1 GB RAM, 10 GB SSD |
For a startup monitoring 50 to 100 endpoints, a basic 1 GB RAM VPS is more than enough.
Conclusion
When you install Uptime Kuma on a VPS with Docker Compose, back it with an Nginx reverse proxy, secure it with a free Let’s Encrypt certificate, add Telegram or email alerts, and publish a public status page, you get a monitoring stack without cost.
We hope you enjoy this guide.
FAQs
Can I monitor non-HTTP things with Uptime Kuma?
Yes. Besides websites, you can monitor TCP ports, ping/ICMP, DNS, Docker containers, databases, and more.
Can I have multiple status pages in Uptime Kuma?
Yes, Uptime Kuma supports multiple status pages, each with its own slug and custom domain since version 1.13.0.
How do I stop Uptime Kuma from being exposed directly on port 3001?
By binding Docker to 127.0.0.1:3001 instead of 0.0.0.0:3001, port 3001 is only reachable locally, and Nginx handles all public traffic.
